Launch Splicejam
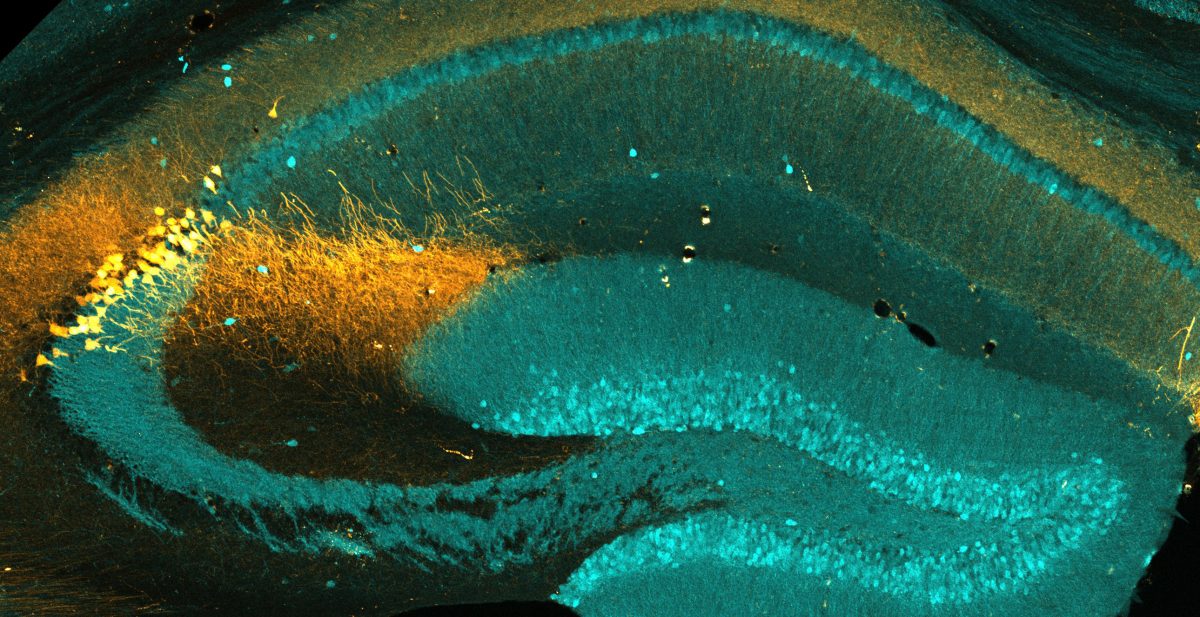
 Splicejam is a shiny-app resource that visualizes mouse hippocampal subregion- and compartment-specific RNA-seq data described in Farris et al. The purpose of this resource is to provide the community with a user-friendly interface to mine the data for isoform-specific differences across hippocampal subregions (CA1, CA2, CA3, DG) and subcellular compartments (Cell Body, Dendrites).
The RNA-seq data is visualized using sashimi plots that plot RNA-seq coverage data alongside splice junction-spanning sequence reads, using compressed intron genomic coordinates.
Click HERE to report bugs or issues with Splicejam.
- The methods were developed in support of S. Farris, J. M. Ward, K.E. Carstens, M. Samadi, Y. Wang and S. M. Dudek, 2019: Hippocampal subregions express distinct dendritic transcriptomes that reveal differences in mitochondrial function in CA2
- Sashimi plots were originally envisioned by MISO Katz, Y, Wang ET, Silterra J, Schwartz S, Wong B, Thorvaldsdóttir H, Robinson JT, Mesirov JP, Airoldi EM, Burge, CB.: Sashimi plots: Quantitative visualization of alternative isoform expression from RNA-seq data.
Splicejam is also available as an R package and is part of a suite of RNA-seq analysis R packages, collectively called “jampack” which is available through GitHub, see https://github.com/jmw86069/jampack
For vignettes on how to use Splicejam on other RNA-seq datasets go to: https://jmw86069.github.io/splicejam/

You must be logged in to post a comment.